
Last week we introduced Part 1, which can be read HERE. This is a continuation of this in depth look at facts pertaining the energy. These facts will hopefully make our debate over energy issues become ore fact-based and less emotionally based.)
Introductory Notes
In keeping with Just Facts’ Standards of Credibility, all graphs show the full range of available data, and all facts are cited based upon availability and relevance, not to slant results by singling out specific years that are different from others.

Pollutants
When modern energy is unavailable or expensive, people tend to burn more wood, crop waste, manure, and coal in open fires and simple home stoves. Open fires and home stoves do not burn fuel as efficiently as commercial energy technologies, and hence, they produce elevated levels of outdoor and indoor pollutants. The added consumption of wood also causes deforestation. [63] [64] [65] [66] [67]
* Assessing the full environmental impacts of different energy technologies requires looking beyond the effects at a single point of production, use, or disposal. To do this, researchers perform “life cycle assessments” or LCAs. Per the U.S. Environmental Protection Agency (EPA), LCAs allow for:
the estimation of the cumulative environmental impacts resulting from all stages in the product life cycle, often including impacts not considered in more traditional analyses (e.g., raw material extraction, material transportation, ultimate product disposal, etc.). By including the impacts throughout the product life cycle, LCA provides a comprehensive view of the environmental aspects of the product or process and a more accurate picture of the true environmental trade-offs in product and process selection.[68] [69]
* Per a 2008 paper in Environmental Science & Technology:
Indeed, all anthropogenic [manmade] means of generating energy, including solar electric, create pollutants when their entire life cycle is taken into account. Life-cycle emissions result from using fossil-fuel-based energy to produce the materials for solar cells, modules, and systems, as well as directly from smelting, production, and manufacturing facilities. [70]
* The air pollutants generated by energy sources vary with factors such as combustion methods, manufacturing techniques, and pollution control technologies.[71] [72] For example, bituminous coal combusted in a fluidized bed boiler without pollution controls produces one tenth the sulfur dioxide of the same fuel burned in a cyclone boiler without pollution controls. [73] [74] [75]
* In general:
- electricity generated by nuclear, hydropower, solar, geothermal, and wind energy emits a fraction of the air pollutants of fossil fuels. [76] [77] [78] [79] [80]
- geothermal heat pumps generate less pollutants than any other technology for heating and cooling. [81]
- biofuels usually emit less air pollutants than petroleum-based fuels, although some biofuels emit more nitrogen oxides and volatile organic compounds over their lifecycles. [82] [83] [84] [85] [86]
- natural gas combustion generates the lowest air pollutant emissions of all fossil fuels.[87] [88] [89] [90] [91]
- as of 2000, electricity generated by coal combustion created more sulfur dioxide and nitrogen oxides than any other fuel. [92]
* Per the U.S. Department of Energy (2010):
While coal used to be a dirty fuel to burn, technology advances have helped to greatly improve air quality, especially in the last 20 years. Scientists have developed ways to capture the pollutants trapped in coal before they escape into the atmosphere. Today, technology can filter out 99 percent of the tiny particles and remove more than 95 percent of the acid rain pollutants in coal, and also help control mercury. [93] [94]
* In the U.S. from 1990 through 2015, sulfur dioxide (SO2) emissions per Btu of coal-generated energy decreased by 86%, and nitrogen oxides (NOx) emissions decreased by 78%. [95]
* Since the late 1970s, new automobiles have been equipped with catalytic converters, an “anti-pollution device” that converts “exhaust pollutants … to normal atmospheric gases such as nitrogen, carbon dioxide, and water.” [96] [97][98]
* Facts about air pollution levels and their effects are detailed in Just Facts’ research on pollution.
Greenhouse Gases
* Carbon dioxide (CO2) contributes more to the greenhouse effect than any other gas released by human activity.[99][100]
* In general:
- electricity generated by nuclear, solar, geothermal, and wind energy emits a fraction of the greenhouse gases of fossil fuels.[101] [102] [103] [104] [105]
- hydropower’s “air emissions are negligible because no fuels are burned. However, if a large amount of vegetation is growing along the riverbed when a dam is built, it can decay in the lake that is created, causing the buildup and release of methane, a potent greenhouse gas.”[106]
- when extracting natural gas, coal, and petroleum from the ground, uncombusted methane can be released. Methane is a greenhouse gas that is 28 times more potent (per unit mass) than CO2.[107] [108] [109]
- When combusted, fossil fuels emit the following amounts of CO2:

* Biofuels such as ethanol generate CO2 when burned, but the crops used to make these fuels absorb an equal amount of CO2 as they grow. However, planting, fertilizing, harvesting, processing, and distributing ethanol emits more CO2 than extracting, refining, and distributing gasoline.[111] [112] [113] [114] [115]
* Per the U.S. Congressional Budget Office (CBO), lifecycle analyses comparing CO2 emissions of corn-based ethanol and gasoline have produced varying results, but the most authoritative study in the eyes of the federal government (conducted by Argonne National Laboratory) estimates that, on average, corn-based ethanol produces about 20% less CO2 than gasoline.[116]
* Another type of biofuel called cellulosic ethanol has the potential to produce 60-95% less CO2 emissions than gasoline. This fuel is more difficult to manufacture than regular ethanol, and as of 2016, producers have been unable to make enough of it to meet the mandated amounts specified in federal law.[117] [118] [119] [120][121] [122] [123]
* Converting undeveloped land to cultivate crops for biofuels creates CO2 emissions because existing plant life is removed and the soil is disrupted. If this land is repeatedly used to produce biofuels, the net CO2 emissions will be less than using fossil fuels. The timeframe until this breakeven point occurs depends upon factors such as the type of land converted and type of biofuel produced. Per a 2008 paper in the journal Science, the CO2 breakeven time of converting:
- wetter portions of Brazil’s woodland/savanna region to produce sugarcane ethanol is about 17 years.
- dryer portions of Brazil’s woodland/savanna region to produce soy biodiesel is about 37 years.
- central grasslands of the U.S. to produce corn ethanol is about 93 years.
- lowland tropical rainforest of Indonesia and Malaysia to produce palm biodiesel is about 320 years.
- Amazonian rainforest to produce soy biodiesel is about 320 years.
- tropical peatland rainforest to produce palm biodiesel is about 840 years.[124]
* Per the U.S. Energy Information Administration:
Most of the biodiesel produced in the United States is made from soybean oil. Some biodiesel is also produced from used oils or fats, including recycled restaurant grease. In some parts of the world, large areas of natural vegetation and forests have been cleared and burned to grow soybeans and palm oil trees to make biodiesel. The negative environmental impacts of land clearing may be greater than any potential benefits of using biodiesel produced from soybeans and palm oil trees.[125]
* Facts about greenhouse gases and climate change are detailed in Just Facts’ research on global warming.
* In order to perform useful work, energy usually must be converted from one form to another. Most energy on earth ultimately comes from the sun, and this energy typically undergoes multiple conversions before it is used to accomplish a particular task. For example, the energy that ultimately powers a light bulb may have the following history:
- The process of fusion converts the nuclear energy of elements in the sun into sunlight (electromagnetic energy).
- When sunlight strikes the earth’s oceans, some of it is converted to thermal energy.
- This thermal energy heats the water and causes it to evaporate and rise, thus converting some of it to gravitational energy.
- When this water falls as rain, it fills rivers that drive the turbines of hydroelectric dams, thus converting some of it to mechanical energy.
- This mechanical energy is used to turn generators, thus converting some of it to electrical energy.
- When this electrical energy flows through light bulbs, some of it is converted back to electromagnetic energy (light).[126] [127]
* With each conversion process, some amount of the energy is dispersed, thus making it less useful for performing work. Per the U.S. National Academy of Sciences:
Every time energy changes forms, some portion is “lost.” It doesn’t disappear, of course. In nature, energy is always conserved. That is, there is exactly as much of it around after something happens as there was before. But with each change, some amount of the original energy turns into forms we don’t want or can’t use, typically as so-called waste heat that is so diffuse it can’t be captured.
Reducing the amount lost – also known as increasing efficiency – is as important to our energy future as finding new sources because gigantic amounts of energy are lost every minute of every day in conversions.[128] [129] [130] [131]
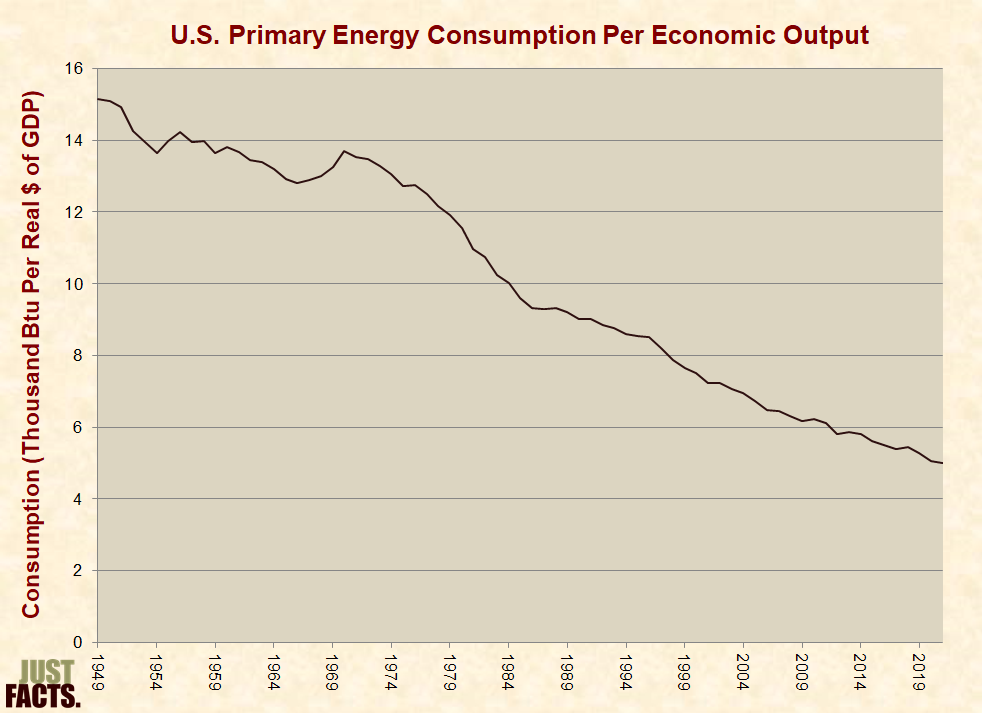
* In the U.S. from 1949 to 2015, energy consumption per inflation-adjusted dollar of economic output decreased by 63%:
* Homes built in the U.S. from 2000-2009 are about 30% larger than homes built prior to this period, but they use about 2% more total energy. This result is primarily due to better insulation and increased efficiencies of heating and air conditioning technologies.[133]
* Homes built in the U.S. from 2000-2009 use about 18% more energy on appliances, electronics, and lighting than older homes.[134] This is because newer homes are more likely to have “dishwashers, clothes washers, clothes dryers, and two or more refrigerators.” Also, because they have more square footage, newer homes tend to have more “computers, TVs, and TV peripherals such as digital video recorders (DVRs) and video game systems.”[135]
* In 2010, the U.S. Government Accountability Office (GAO) published an investigation of Energy Star in which GAO submitted 20 “bogus products” for approval. Fifteen of the products were approved, 2 were rejected, and 3 were unanswered at the time the report was published. Among the products certified as Energy Star compliant were:
- a gasoline powered alarm clock.
- a geothermal heat pump eligible for federal tax credits and state rebate programs that purportedly had higher efficiency than any Energy Star product.
- a computer monitor that was approved within 30 minutes of submission.
- “a room cleaner represented by a photograph of a feather duster adhered to a space heater on our [fake] manufacturer’s Web site.”

* The U.S. Green Building Council, per its website, is a “nonprofit organization committed to a prosperous and sustainable future for our nation through cost-efficient and energy-saving green buildings.”[140] This organization provides various types of green building certifications that qualify the owners for government incentives, such as tax breaks and zoning allowances. This rating system is named LEED for “Leadership in Energy and Environmental Design.”[141]
* In 2012, USA Today conducted an investigation of schools with green building certifications (such as LEED) and found:
- “More than 200 states, federal agencies and municipalities require LEED certification for public buildings.”
- out of 239 schools in the Houston (Texas) Independent School District, three newly built “green schools” ranked 46th, 155th, and 239th for energy costs per student.
- “Building a LEED-certified school often adds 2% to 3% to construction costs, and as much as 10% in the case of a Selinsgrove, Pa., high school….”
- a Green Building Council brochure had claimed that “green schools save money” based upon pre-construction cost estimates of 30 schools. One of these schools, located in Olympia, Washington, was projected to use 28% less energy than conventional schools. In its’ first two years of operations, the school used 19% more energy than conventional schools.
- a Green Building Council brochure had claimed that “green schools help improve student performance,” but aUSA Today “review of student test scores for 65 schools in 11 states that have been rebuilt to get LEED certification and have been open for at least two years” found “no clear pattern” of improved student performance.[142]
* Per the U.S. National Academy of Sciences:
Another familiar form of conversion loss occurs in a vehicle’s internal combustion engine. The chemical energy in the gasoline is converted to heat energy, which provides pressure on the pistons. That mechanical energy is then transferred to the wheels, increasing the vehicle’s kinetic energy. Even with a host of modern improvements, current vehicles use only about 20% of the energy content of the fuel as power, with the rest wasted as heat.
Efficiencies of heat engines can be improved further, but only to a degree. Principles of physics place upper limits on how efficient they can be. Still, efforts are being made to capture more of the energy that is lost and to make use of it. This already happens in vehicles in the winter months, when heat loss is captured and used to warm the interior for passengers.[143] [144]
Costs of Transportation Fuels
* Transportation fuels have different energy densities, and thus, the price per volume of each fuel does not accurately reflect the energy supplied to consumers. For example, the energy content of a gallon of ethanol is 31% less than a gallon of gasoline. Hence, a car fueled with E85 (a mixture of 70-85% ethanol and 15-30% gasoline) will get 25-30% less miles per gallon than the same car when it is fueled with pure gasoline.[145] [146] [147] [148] [149]
* Like ethanol, the volume of biodiesel blended with regular diesel is shown by a number that follows the first letter of the named fuel. Thus, B20 contains 20% biodiesel and 80% regular diesel.[150]
* On an energy-equivalent basis, the average subsidized retail prices (including taxes) for transportation fuels during 2015 were as follows:

* A federal law known as the “Renewable Fuel Standard” requires U.S. consumers to use certain amounts of ethanol and other biofuels. This mandate uses a compliance mechanism that transfers some of the costs of producing these fuels from biofuel companies to petroleum companies. These added costs are then passed on to consumers in the form of higher gas prices.[152] [153] [154] [155]
* During 2015, a federal tax credit subsidized biodiesel at a rate of $1.00 per gallon.[156]
* Federal payments, tax breaks, loans, and loan guarantees subsidize petroleum and natural gas production at a rate of about $0.01 per gasoline-gallon equivalent.[157]
* Combining the data above yields the following average prices for transportation fuels during 2015 without federal subsidies:

To be continued…
 Email this author

- The Most Progressive Budget in Virginia’s History - December 21, 2019
- When is a Clean Water Act Permit Needed? - December 21, 2019
- Should U.S. Consider Modern Monetary Theory to Improve Economy? - December 21, 2019