On the 2008 data, tiny Poquoson continues to deliver more educational bang for the buck than any other Virginia locality.
The SOL scores for 2008 are on the Education Department Web site. As of the end of March, the annual disbursement data also were up (finally!).
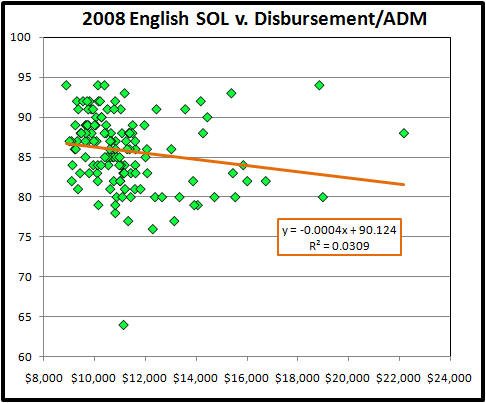
Placed together, these data let us see what kind of SOL performance we are getting for our educational expenditures for each school division in the state. The graph shows the raw numbers for the English test. (Note: The disbursement numbers are total disbursements less payments to reserves and less disbursements for new or remodeled facilities. “ADM” is educratese for Average Daily Membership, i.e., the number of kids).

A glance at this graph suggests that increased spending does nothing for SOL scores. Indeed, the least squares fit to the data asserts that an extra $1,000 per kid lowers the SOL by 0.4 points. The R2, however, tells us that cost and score are essentially uncorrelated.
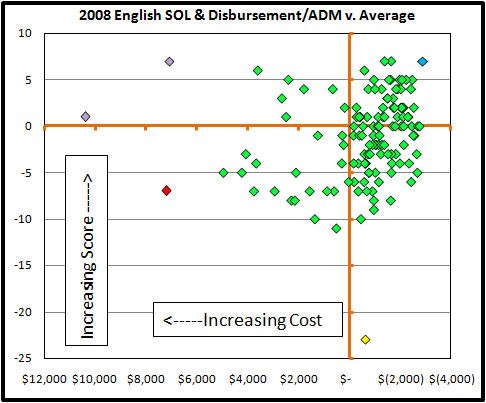
The ideal school division would obtain high SOL scores at low cost. To see which Virginia divisions approach that ideal, let’s reverse the expenditure axis so low costs appear at the high end of the axis. To emphasize relative performance, we’ll plot the scores and per-pupil disbursements as deviations from the average (State average English SOL = 87; average disbursement/student = $11,781).
We might call the resulting graph the Bacon’s Rebellion Bang per Buck graph. On that graph high test scores are at the top and low expenditures are at the right. The best performance for the lowest cost — the biggest bang per buck — will be at upper right.

The blue point at upper right is Poquoson. That small Tidewater division turned out an English SOL pass rate of 94, seven points above the state average, at the lowest cost per student, $8,888, which is $2,893 below the state average.
In contrast, the good citizens of Alexandria (the red point) paid $7,210 more than the state average ($18,991 per pupil) and got an SOL performance seven points below the state average.
The low-cost, low-performance jurisdiction, the yellow point at bottom right, is Petersburg, where $11,145, $636 less than average, produced an English score of 64, 23 below the state average.
To see how badly Poquoson beat your school system, follow this link.
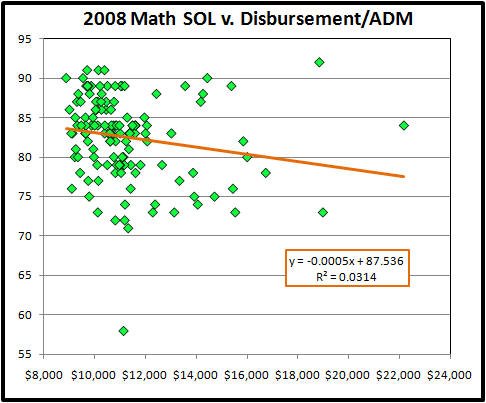
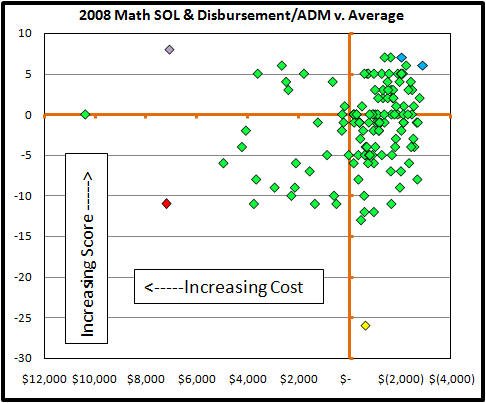
Here are the graphs for the math test:


Poquoson again leads the pack. The other blue point is Scott County, which got one point more math performance than Poquoson at an additional cost of $823 per pupil. The entire math dataset is here.
Send an email to john{at}crankytaxpayer{dot]org if you would like the spreadsheets with these data.
- The Most Progressive Budget in Virginia’s History - December 21, 2019
- When is a Clean Water Act Permit Needed? - December 21, 2019
- Should U.S. Consider Modern Monetary Theory to Improve Economy? - December 21, 2019
